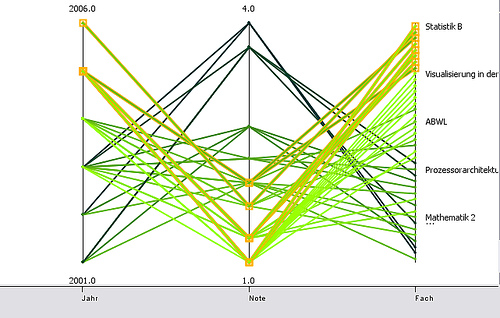
A Parallel Coordinate Graph can be a little tricky to read. The up and down slopes of the lines indicates change through time from one value to the next. The lines in parallel coordinate displays don't indicate change. Instead, a single line in a parallel coordinates graph connects a series of values - each associated with a different variable - that measure multiple aspects of something.
No comments:
Post a Comment