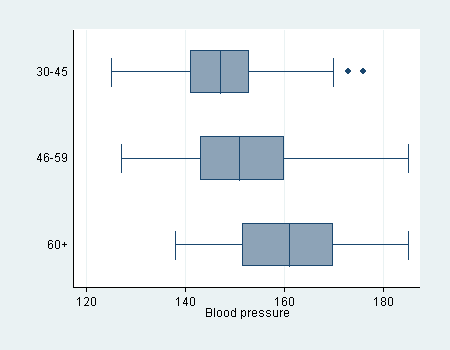
This box plot data explains the age ranges of adults and their blood pressure. The middle line in the box plot for the age range 30-45 shows that the median blood pressure for people of that age is approx 145. The outlines of the box show the next highest and lowest percentiles (25% and 75%)... reading at 141 and 155. The horizontal lines extending out portray the 10th and 90th percentile at 125 and 170. The two dots on the right hand side are values greater than the 90th percentile- 175 and 177.
No comments:
Post a Comment